


Macroeconomic Policy

This section discusses macroeconomic and fiscal management at some length, regulatory and other market interference policies, and trade.
The two principal economic managers of the Philippines (the Secretary of Finance and the BSP governor) have been recognized by the international financial community for over two decades for responsible macroeconomic management. Inflation, exchange rates, debt management, budget deficit control, foreign exchange reserves, and the like have – with significant exceptions – been well-managed.238 In recent years, the biggest challenges have been large deficits and a declining tax effort. Philippine reactions to exogenous shocks, such as the 1997 Asian financial crisis and the 2008 global financial crisis, were also generally well-managed.239
• Rating macroeconomic management
In the WEF Global Competiveness Report, among the ASEAN-6, the Philippines places mid-way behind Singapore, Malaysia, and Thailand but ahead of Vietnam and – until recently – Indonesia in the rankings for overall macroeconomic environment. The category measures national government deficit and debt, savings rate, inflation, interest rate spread, and sovereign credit ratings.
The rating of Indonesia advanced past the Philippines in 2009, and both Malaysia and Thailand in 2010 and was almost ranked at the level of Singapore. Thus the Philippines must do better to manage its tax effort and fiscal deficit challenge to catch up with the four better-ranked ASEAN economies (see Figure 197).
 View original figure here
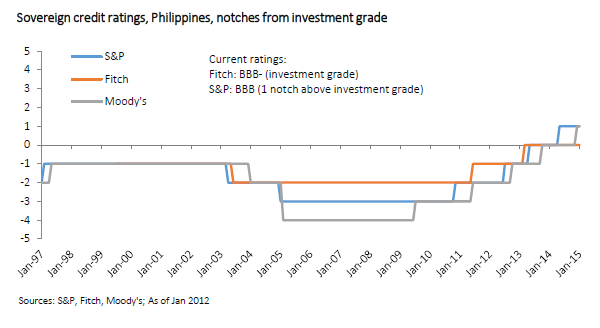
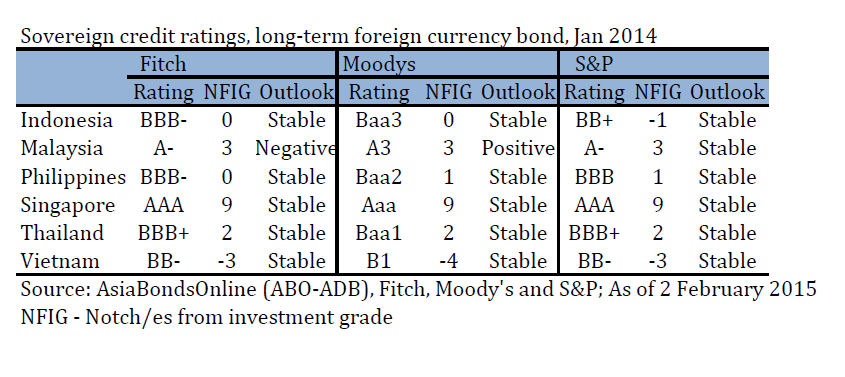
Other measures of macroeconomic performance are sovereign ratings of Philippine government long-term foreign currency bonds by leading rating agencies, which judge the factors that determine the quality of debt instruments in terms of notches below or above investment grade. Because the ratings reflect the agencies’ assessments of the macroeconomic management of the economy, they influence the interest rate the government pays to borrow foreign currency. The ratings for the last decade by Fitch, Moody’s, and Standard & Poor’s appear in Figure 198. Table 78 shows the ratings for the ASEAN-6 in mid-2010, when the Philippines was rated the lowest, close to Vietnam.
View original figure here
View related figures here
View original table here
• Inflation and exchange rates
Figure 199 shows annual inflation in the Philippines since 1990, during which period it averaged 7.2%. Inflation was highest at 19.3% in 1991 and lowest at 2.8% in 2007.
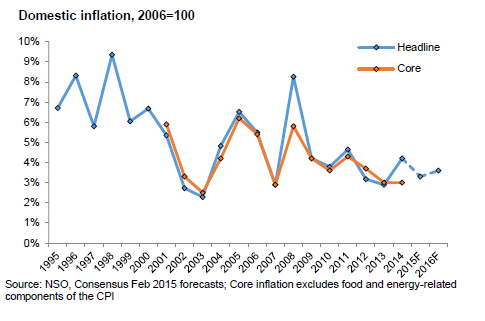
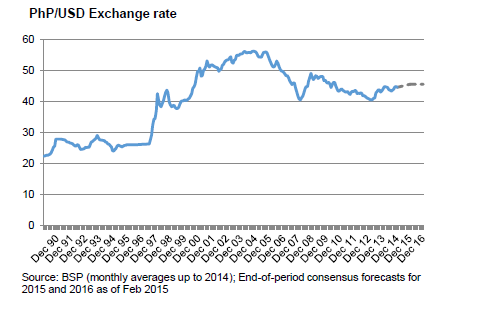
Figure 200 shows the more than 150% depreciation of the Philippine peso against the US dollar over almost 15 years, from 22.5 PhP/US$ in January 1990 to 56.3 in October 2004. The peso then began to strengthen over a 5-year period to 46.4 at the end of 2009. In 2010 it further strengthened to below 44.
View original figure here
• National government debt
The Philippines has managed its national government debt reasonably well in the quarter century since a moratorium on payments of its foreign currency debt of US$ 24.4 billion was declared on October 17, 1983, near the end of the Marcos administration, eventually leading to debt restructuring and IMF support. The issue of debt is sometimes controversial in the Philippines, with some advocates urging a complete moratorium, without considering the dire consequences on future government financing, as well as the ethical issue of not meeting contractual financial obligations. Figure 201 shows a steadily rising total national debt (both foreign and domestic) in peso terms, increasing greatly in absolute terms but not very much in percentage of GDP terms over two decades.
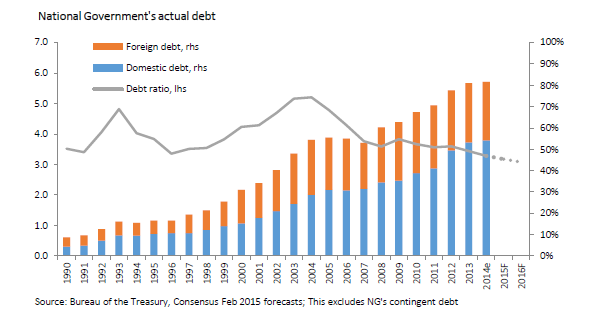
View original figure here
View related figure here
Figure 202 shows the burden of debt service and how deficit spending in recent years has added to debt service as more money was borrowed to finance borrowings. Debt service as a percent of national government revenue reached some 87% in 2006, before being reduced to 54% in 2007, while debt service as a percent of GDP has fallen below 10% since 2006. If the economy is able to sustain higher GDP growth rates and increase national government revenue collection, the debt service burden should ease further in the future.
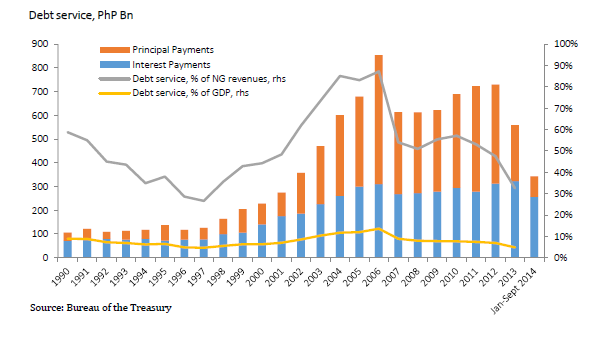
View original figure here
Figure 203 shows external debt as a percent of GDP and gross international reserves (GIR) since 1986. Both data graphs show positive trends. External debt has fallen from nearly 99% of GDP at the end of the Marcos administration to a much lower percentage close to 30% in 2009. With the appreciation of the peso in recent years (see Figure 200), the cost of servicing some of the external debt has fallen. In addition, the low global interest rate regime benefitted the country, and total debt service as a percent of GDP declined in 2009 despite the budget deficit reaching nearly PhP 300 billion, the highest in Philippine history.
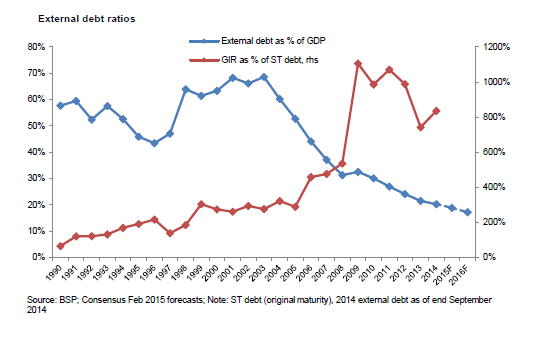
View original figure here
• Budget deficits, the CPSD, and GIR
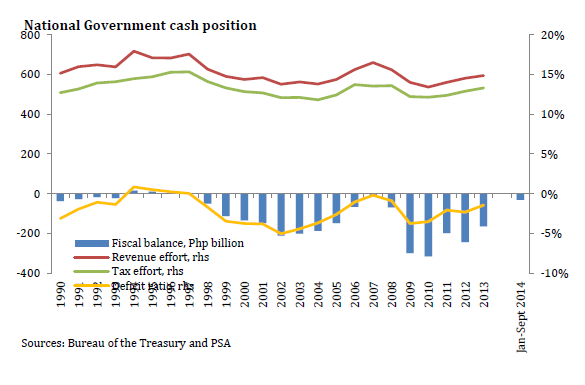
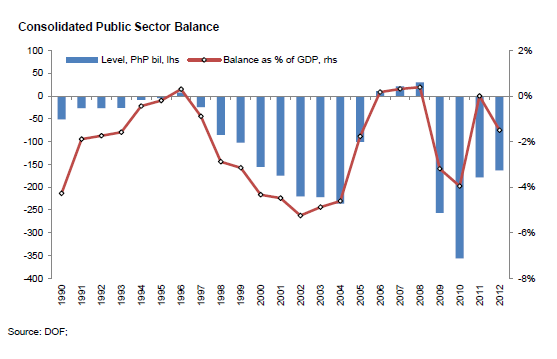
Budget deficits and tax collections are the two most worrisome aspects of current national fiscal management. Figure 204 shows (1) budget deficits, (2) revenue effort, (3) tax effort, and (4) deficit ratio, all from 1986 to 2009, and is divided into the performance of each of the four presidential administrations since Marcos. The green line indicates the deficit ratio and is different than the Consolidated Public Sector Deficit (CPSD) (see Figure 205).
The first Aquino administration began with a deficit ratio close to -6%, which gradually improved until becoming positive in 1994 for three years during the Ramos administration. From the Asian financial crisis in 1997 until a decade later in 2007 it remained negative, again approaching -6% in 2002, largely driven by a weakened tax structure. The global financial crisis in 2008-2009 moved it once again towards -6%.240
View original figure here
View original figure here
Political maneuverings during and after the 2004 elections prompted the government to disburse resources and compromise fiscal discipline in exchange for political loyalty of some in the Congress and local government for projects with only marginal benefit, pushing the balance deeper into the red. Following passage of the EVAT the deficit improved steadily in an effort to avert a looming fiscal crisis, regaining budgetary balance in 2006.
In the following two years four factors combined to drive it back into negative territory: (1) as observed by the International Monetary Fund in 2007, imports may have been under-recorded by as much as 2 percent of GDP for election-related purposes and which local observers estimated cost the government PhP 20-30 billion annually in duties and taxes; (2) in 2008 the global financial crisis depressed economic activity and tax revenues, and required increased government relief and recovery expenditures; (3) in 2009, two severe typhoons caused severe damage in Central Luzon, and (4) concurrently, the Congress (see below) passed numerous revenue-depleting tax measures, which the former president did not veto despite recommendations by the Secretary of Finance.
The results of this budgetary “perfect storm” was a deficit of PhP 298.5 billion (3.9% of GDP) in 2009, the largest deficit in Philippine financial history.
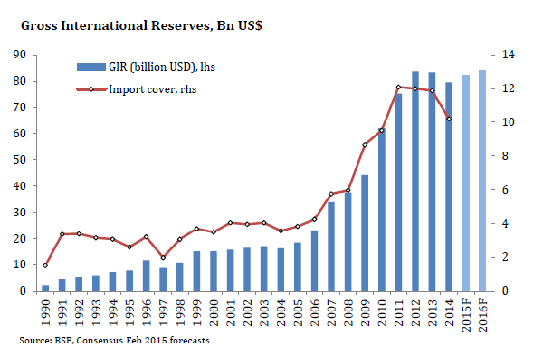
Philippine gross international reserves have grown steadily to a total approaching US$ 50 billion. More importantly, the import cover has more than doubled over the last decade from four to nine months, providing a greater margin of protection in a crisis (see Figure 206).
View original figure here
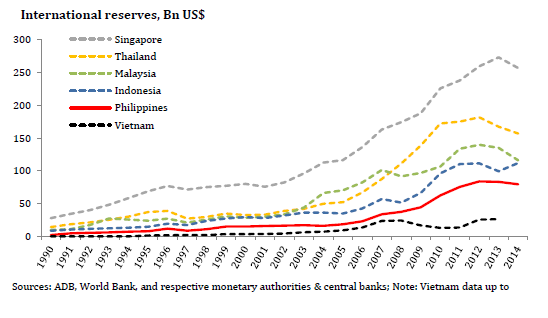
Figure 207 shows the GIR for the Philippines compared to the ASEAN-6.
View original figure here
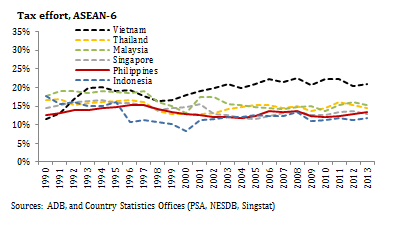
The Philippine tax effort as a percent of GDP peaked in 1997 at 17% and is currently only 12.8%. While this is not greatly different than the other ASEAN-6 economies except for Vietnam (see Figure 208), when combined with low private sector investment, it restrains economic growth. With a population soon to reach 100 million and crowded and dilapidated physical and social infrastructure, there is inadequate funding available in the budget for physical and social infrastructure. Also, the tax effort in 2009 is only 0.4 percentage point higher than the rate in 2004 when the country almost slumped into a full-blown fiscal crisis.
View original figure here
• National government budget and gross domestic savings
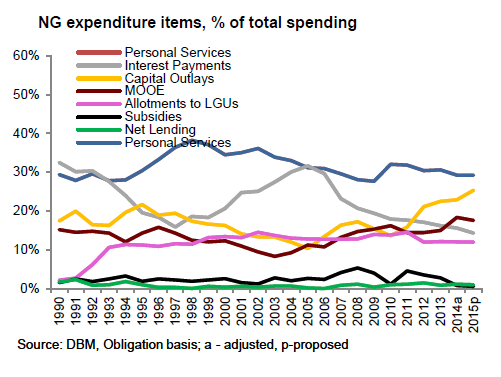
Figure 209 shows how the national government budget is divided among personal services, interest on debt, capital outlays, maintenance and other operating expenses, allotments to LGUs, subsidies, and net lending categories.
View original figure here
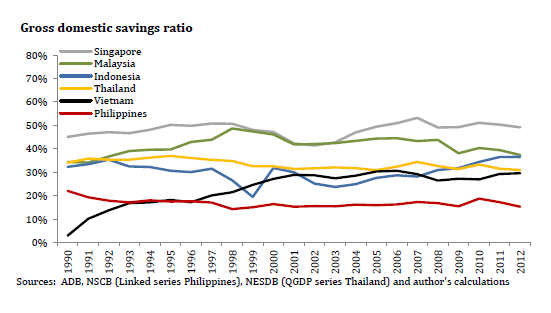
From being the most financially “risk-aware” member ASEAN, Filipinos now have the lowest saving rate of the ASEAN-6. Total domestic savings declined to only 16% of GDP in 2009 from an average of 27% before 1983 and far below the 25-50% present range of the other five ASEAN-6 (see Figure 210). Recent data show that corporations and government have raised their savings rate. A decade ago personal savings accounted for more than the other two combined but have fallen sharply.
View original figure here
View related figure here

The low savings rate limits the ability of households to take advantage of investment opportunities, causes difficulties in adapting to sudden changes that necessitate expenses (e.g. natural calamities or income shocks) and makes it difficult for families to rise above poverty. Sources of funds for many Filipinos go beyond the formal financial system. Relatives usually provide assistance whenever financial problems arise.
A higher capital inflow is needed to achieve higher rates of economic growth. Official development assistance, foreign borrowing, and foreign investment in the Philippine Stock Exchange (PSE) total about US$ 4-5 billion a year, while FDI and the value added of exports adds roughly US$ 15 billion. But much more should flow in for faster economic growth. Remittances have grown steadily to almost US$ 20 billion but are largely spent on consumer goods, which have a large import component.
The savings rate can be improved by strengthening domestic capital markets and providing savers more options and incentives to save. There should be more listings on the PSE, which has one of the lowest capitalizations and daily turnovers in Asia. Total deposits in the Philippine banking system are not large, even by developing country standards. More foreign banks should be licensed to operate and allowed to operate more branches. There is potential to create new investment vehicles for the increasingly better-off overseas Filipino community to invest in the Philippines. Educational curricula do not include financial planning, and the local culture reinforced by extensive advertising provides consumption rather than savings.
Markets for bonds and mortgage-backed securities have developed since the passage in early 2004 of the Documentary Stamp Tax (DST) Rationalization Act and the Securitization Act. More credit for micro-finance and small-to-medium enterprises (SMEs) is needed to stimulate small and micro businesses.
• Taxation
Compared to the ASEAN-6, taxation in the Philippines significantly limits incentives to work and invest. The Philippines is ranked 77th of 139 countries, while Vietnam is 58th, Thailand 53rd, Malaysia 28th, Indonesia 17th, and Singapore 3rd. This rating clearly suggests the Philippines should consider ways to restructure its taxes and make collection more efficient and less corrupt (see Figure 213).

View original figure here
The Philippines imposes some of the highest taxes among the ASEAN-6. The Philippine Corporate Income Tax (CIT) is 30%, while Vietnam is 35%, Thailand is also 30%, Indonesia and Malaysia are both 25%, and Singapore is 17%. The personal income tax in the Philippines is 32%, while Thailand is 37%, Vietnam is 35%, Indonesia is 30%, Malaysia is 26%, and Singapore is 20%. The VAT/sales tax in the Philippines is 12%, 16% in Vietnam, 10% in Indonesia, 5-10% in Malaysia, and 7% in Singapore and Thailand (see Table 79).
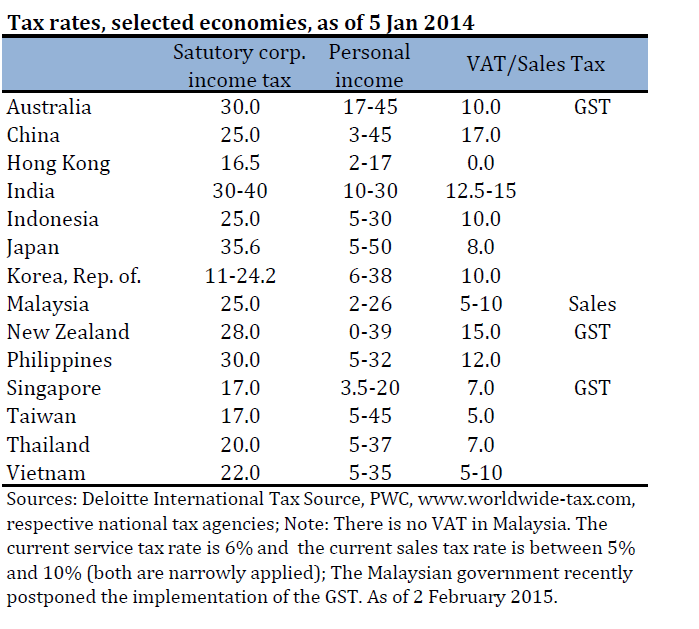
Figure 214 shows Philippine corporate income taxes in comparison with other Asian countries. They are near the higher levels, which tend to discourage investment as well as compliance.

View original figure here
Figure 215 shows Philippine individual income taxes in comparison with other Asian countries. Top rates in the Philippines are in the middle of the region.
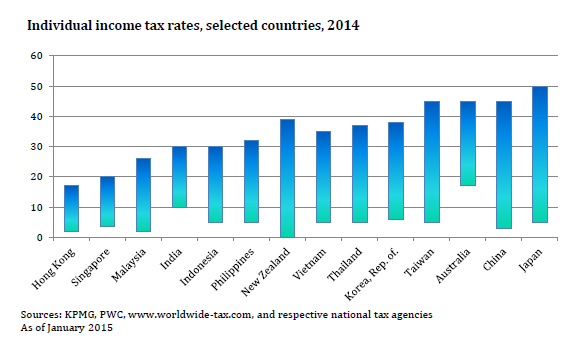
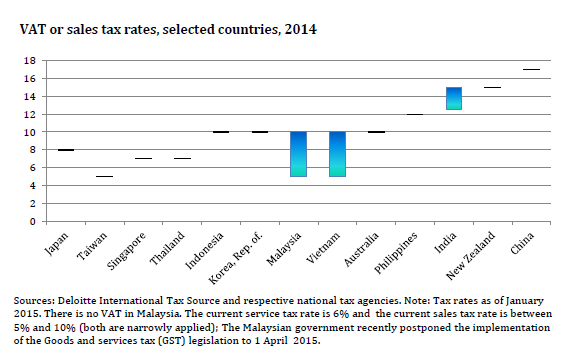
Figure 216 shows VAT or sales tax rates in selected Asian countries, with the Philippines, among the ASEAN-6, lower than Vietnam but higher than Singapore, Thailand, Indonesia, and Malaysia.
In the World Bank rating Paying Taxes, 2009 and 2010, the Philippines is rated behind Malaysia and Thailand and about the same as Indonesia and Vietnam (see Table 80). A concerted effort to simplify the number of taxes and the processes for paying them should improve these ratings of the Philippines.

View original table here
The new Secretary of Finance has estimated annual tax leakage at PhP 250 billion, or more than US$ 5 billion. The majority of this amount is caused by smuggling and tax evasion, which requires better enforcement to correct. Also, of this total the DOF estimates PhP 84 billion a year is being lost as the result of tax-eroding measures enacted in the 14th Congress, negating most of the revenue gains from the EVAT. The EVAT, which went into effect in November 2005, was the major tax reform of the Arroyo administration.
Among these tax-eroding measures were:
(1) Individual income tax relief (RA 9504),
(2) Corporate income tax reduction (RA 9337),
(3) Abolition of DST on secondary trading stocks (RA 9468),
(4) Tourism incentives (RA 9593),
(5) Personal Equity and Retirement Account (RA 9505),
(6) Real Estate and Investment Trust (RA 9856),
(7) EVAT Exemption for Senior Citizens (RA 7432), and
(8) Bataan and Aurora Freeport Zones (RA 9728 and RA 10083).
While several of these had sound rationales, compensatory increases in taxes were not legislated thus creating a negative impact on public sector revenue collection. The GRP tax effort consequently declined from 14% in 2007 to 12.8% in 2009.
In recommending a moratorium on the passage of legislative proposals to establish more special economic zones and freeports, Finance Secretary Cesar Purisima said “This is in line with our policy of deficit-neutrality which we would seriously like to advocate in the current administration, based on the principle of responsible fiscal resource management. We need to control the erosion of the tax base or exercise control over spending so that we can secure the necessary resources to fund the basic socio-economic needs of the people.”
—Philippine Star, October 8, 2010
• Regulatory practice
Government regulations place a heavy burden on the private sector. Numerous surveys have identified dealing with the government as a leading complaint of businessmen. In the World Bank
2010 rankings for the category burden of government regulation, the Philippines placed 126 of 133 countries, not just the lowest among the ASEAN-6 but one of the lowest of the total countries ranked (see Figure 217). While Vietnam (ranked 120th), a heavily-regulated communist state, was rated about the same as the Philippines, Thailand (42nd), Indonesia (36th), Malaysia (17th), and Singapore (1st) made the country look very bad in comparison. Clearly, this indicator needs urgent and sustained efforts to improve until it catches up with Thailand and Indonesia.

View original figure here
Government regulatory agencies have been subject to influence and even capture by the industries they are charted to regulate. Historical examples include the Civil Aeronautics Board (CAB), Energy Regulatory Commission (ERC), Land Transportation Franchising and Regulatory Board (LTFRB), Maritime Industry Authority (MARINA), National Food Authority (NFA), National Telecommunications Commission (NTC), Philippine Ports Authority (PPA), Sugar Regulatory Administration (SRA), and the Toll Regulatory Board (TRB). Strict separation between regulators and those regulated is essential to reduce oligopolistic practices and conflicts of interest in these sectors.
“How can regulators best engage with the industries they regulate? How can they produce “smart regulations” that protect health and safety without slowing economic development and job creation?…Too often, divergent regulatory frameworks around the world unnecessarily raise the cost of doing business, close markets to competition, choke off innovation, produce unintended consequences, and fail to achieve the desired regulatory outcome.”
—John Murphy, vice President U.S. Chamber of Commerce, speech in Santo Domingo, DR, March 4, 2010
• Policy stability and predictability
It has been stated many times that investors seek a stable and predictable policy environment with low risk that enables expected return on investments. Yet in the Philippines, such stability has often not been a consideration in policy making by government, despite assertions of the importance of foreign investment.
Five illustrative examples in recent years that received international attention include: (1) IBM was loudly accused of providing bad software products on national radio and in the press by the head of a large public sector agency, (2) when oil companies raise prices following global price rises, they have often been accused of price collusion, (3) after a severe typhoon flood, the government imposed oil price controls to assist the victims when most did not own cars; oil imports nearly ceased, (4) under a law known as the Cheaper Medicines Act pharmaceutical companies were ordered to reduce their prices “voluntarily,” and (5) cement companies were accused by the DTI of selling at prices much higher than imported cement despite very high local costs of production.
Market distorting policies also originate in legislation from the Congress. Examples include: (1) legislated minimum wages that are popular with some workers but which discourage investment and force some companies into the underground economy, (2) legislated new holidays which are popular with regular employees but prevent casual workers from having a day’s work and add to business costs, (c) the Customs Brokers Act, which prevented companies from handling their own customs paperwork and slowed down the movement of goods, and (d) proposed amendments to the Milk Code law that would restrict marketing of products in ways not done elsewhere.
• Trade
With a considerable number of major free trade agreements entering into force (see Table 81), the Philippines is presented with great opportunities to develop new markets for its exports. Philippine firms need more information on these opportunities and assistance from the government with cutting business costs in order to increase their competiveness.

The agreements listed in Table 81 are all with Asian economies. The Philippines cannot afford to be left out of free trade agreements that other Asian countries are negotiating with the United States and Europe.
The Philippines and the US have a Trade and Investment Framework Agreement (TIFA) but not a Bilateral Investment Treaty (BIT). The US is negotiating to expand the Trans-Pacific Partnership (TPP) with current members Australia, Brunei, Chile, New Zealand, Peru, Singapore, and Vietnam. The goal is to include additional Asia-Pacific countries in successive clusters eventually to cover a region that represents more than half of global output and over 40 percent of world trade. Malaysia has announced its application to join the TPP, and Japan was reported in the press as very interested in joining but unsure it would be able to open its highly-protected agricultural sector.
The EU and the Philippines have agreed on a new, bilateral, Partnership and Co-operation Agreement (PCA). This agreement builds on and updates the 1980 EC-ASEAN Cooperation Agreement. Building on the PCA, discussions are underway regarding a possible Free Trade Agreement between the EU and individual ASEAN members, including the Philippines.
As shown in Figure 218, the Philippines should also work on improving the burden of its cumbersome, bureaucratic and reportedly corrupt customs procedures, where it is ranked by the WEF as last among the ASEAN-6.

View original figure here
The Philippines is also low-ranked among the ASEAN-6 for its prevalence of trade barriers rank (see Figure 219).

View original figure here
Headline Recommendations
- Constantly improve financial sector management. Reduce the record high public sector deficit, maintain low inflation, stable exchange rates, reduce debt service burden, increase capital spending, privatize more state assets, convey an austerity message, reduce congressional pork barrel.
- Maximize tax collection, jail smugglers and big tax evaders, using RATE and RATS. Use transparency/e-governance, National Single Window, E2M. Simplify taxes and fees. Undertake comprehensive tax reform to reduce CIT and individual income tax, while raising VAT, ACT, and fuel excise taxes. Reduce or eliminate small taxes and fees that increase business costs.
- Increase the low savings rate and strengthen capital markets. Increase independence of regulatory agencies and reduce the burden of government regulation on the private sector. Maintain policy predictability and stability. Take advantage of new trading opportunities.
Recommendations: (29)
A.Improve macroeconomic policy management and raise sovereign credit ratings. Seek to maintain relatively stable inflation and foreign exchange rates. (Medium-term action DOF and BSP)
B.Gradually reduce the national budget deficit to below PhP 100 billion and the Consolidated Public Sector Deficit to below 3% through improved revenue collection, followed by tax reform. (Medium-term action DOF, DBM, BIR, BOC, and Congress)
C. Through prudent debt management, reduce the public external debt as a percentage of GDP ratio and reduce interest payments as a percentage of government expenditures. (Medium-term action DOF)
D.The political leadership, with strong multisectoral support, should convey an austerity message, in word and by example. The political leadership should establish its credibility for following taxing and spending politics that are frugal and avoid waste and difficult to sustain populist policies. (Immediate action OP, cabinet members, and Congress)
E. Privatize more state assets. While major privatizations have been made over two decades (e.g. PAL, MWSS NCR water, NPC power plants, TRANSCO, and PNOC-EDC), many government assets remain to be sold or leased (e.g. Food Terminal Incorporated (FTI) in Taguig, military facilities in NCR, SMC shares of Coco Levy Fund, other assets sequestered by the Presidential Commission on Good Government (PCGG), and GOCCs that could be better run by the private sector). (Medium-term action DOF, PMO, PCGG, and courts)
F. Reduce corruption in public sector revenue collection and expenditure through more transparency, e-governance, competitive bidding, and enforcement at all levels of government. (Medium-term action all government revenue collection and procurement agencies)
G.Continue the BOC’s National Single Window Program interconnecting 40 government agencies involved in licenses, clearances, and permits for import/export transactions and the E2M Project, which will fully automate import/export processing at all major ports in the country. (Immediate action DOF and BOC)
H.Reduce and rationalize congressional pork barrel. Persuade Congress to do its part to control waste in government by reducing pork barrel and spending it better on national priority projects. (Medium-term action DBM, DPWH and other departments, and Congress)
I.Improve collection of current taxes. (Immediate action DOF, BIR, BOC, DOJ, courts, and Congress)
- I1. All taxes due to the national government should be collected from all taxpayers to reduce the huge losses from smuggling and tax evasion.
- I2. Increase computerization of relevant data to enable BIR and BOC to better estimate taxpayer liabilities.
- I3. Enable more e-transactions to reduce direct interaction between taxpayers and BIR personnel, especially outside BIR offices.
- I4. BIR and BOC should maintain the Run After Tax Evaders (RATE) and Run After the Smugglers (RATS) programs and regularly initiate cases against tax evaders and smugglers, accompanied by publicity and successful prosecution.I5. Pass Simplified Net Income Taxation (SNITS) legislation.
H. LGUs should be more efficient in updating and collecting local real estate and other taxes to improve their revenue base. (Medium-term action DILG and LGUs)K. Implement new revenue-enhancement legislative measures and cease passing unwarranted tax leakage laws. Implement the Revised Kyoto Convention. Pass the Fiscal Responsibility Act, Rationalization of Fiscal Incentives bill, Tariff and Customs Modernization Act, and slow down if not cease the passage of unwarranted tax-eroding measures. (Immediate Action DOF and Congress)
L. Comprehensive reform of taxes should be considered after revenue collection efficiency results are achieved. Fees that increase business costs should be avoided and existing ones reduced or eliminated. (Medium-term action DOF, BIR, BOC, DBM, all government agencies, and Congress.)
- L1. Taxes and fees and their collection should be greatly simplified.
- L2. Taxes should be more progressive than regressive. The poorest sector should be provided relief through conditional cash transfers and discount programs (e.g. Residential Electricity Lifeline Rate.)
- L3. Taxes on corporate and personal income should be reduced (eventually to 25%) to incentivize working and compliance.
- L4. Taxes on consumption should be increased (eventually to a 15% EVAT).241 Other consumption taxes including alcohol, cigarettes, tobacco (ACT) and fuel excise taxes should be increased.
- L5. Reduce or eliminate many of the fees and taxes that increase the cost and efficiency of doing business (e.g. airport fees, travel tax, CCT, CIQ charges, BOC de minimus, financial transaction fees, GPB, and port charges.)
M.BIR and BOC Reform. Exemption of BIR and BOC employees from the Salary Standardization Act should be implemented. (Medium-term action Congress)
N.Settle TCC arrears due foreign investors who have paid taxes that were to be credited to subsequent tax liabilities or to be refunded and for which sufficient funds have not been appropriated. Allow the cross-application of TCCs of the BOC and the BIR. Design policies that will address future TCC refunds. (Medium-term action DOF)
O. Increase the savings rate and strengthen domestic capital markets. Encourage more PSE listings. Build bond and secondary markets for mortgage-backed securities. Allow more foreign banks and insurance firms to operate and ease restrictions on foreign bank operations. Introduce financial planning in school curricula and increase efforts to build a culture of savings. (DOF, BSP, Insurance Commission and Congress)
P. Increase the independence of regulatory agencies. To increase competition in regulated industries, reduce the “capture” of regulatory agencies by the appointment of independent directors and managers, with transparent agency decision-making and strict monitoring by the public. (Medium-term action various agencies and supervisory departments, and private sector)
Q. Reduce the burden of government regulation on the private sector. Encourage the executive branch and Congress to become “smarter” regulators in their writing and administration of laws, protecting health and safety without slowing economic growth and job creation and avoiding undesirable effects on business costs, competition, and innovation. (Medium-term action all government agencies)
S.Maintain policy predictability and stability. Once policies are well-established through debate and implementation, maintaining them in a predictable and stable fashion creates a more positive climate for investors, who prefer that unpredictable risks are minimized. (Long-term action all government agencies and Congress)
T.Take advantage of new trading opportunities under the various new Asian regional free trade agreements. Negotiate new free trade agreements with Europe and the US. Study changes needed to be able to conclude these agreements, organize workshops about their expected benefits, otherwise educate local leaders about changes the Philippines should make for compliance. (Medium-term action DTI and Congress)
Footnotes
- A significant exception was the period before the 2004 elections when the deficit grew unexpectedly to around PhP 200 billion in 2002, 2003, and 2004 and the Consolidated Public Sector Deficit rose to 5.6% of GDP. A prominent group of economists at the University of the Philippines warned of an impending financial crisis. After the elections, losses of the NPC ended and the EVAT was passed yielding essential new revenues for the government.[Top]
- Oil and rice prices are both politically sensitive issues in the Philippines because of their effect on the local cost of living. Like many governments, the GRP has traditionally sought to moderate their impact through interventions in the free market. The oil market was deregulated in 1998 after more than two decades of regulation. In contrast, the influence of the National Food Authority (NFA) on the rice market has long been controversial, both from an economic and a governance viewpoint. In economic terms, NFA competes with private traders in buying local rice, imports rice to avoid shortages, then sells into the local market, usually at a loss. In governance terms, NFA’s foreign purchases provide opportunities for corruption, and its heavy losses have been criticized as wasteful. DOF Finance Undersecretary Jeremias Paul, Jr. in September 2010 said in a press briefing that NFA deficit could reach PhP 72 billion in CY 2010. The Aquino Administration is seeking to reduce such government budget liabilities in the future.[Top]
- Heavily-indebted European countries in mid-2010 had higher deficits ratios: Greece (-13.6%), Spain (-11.2%), France (-7.5%), and Italy (-5.3%).[Top]
- Reducing income taxes to 25% and increasing the EVAT to 15% has been recommended by many Philippine economists and by former Secretary of Finance Margarito Teves, e.g. in his DOF Terminal Report to the President dated June 21, 2010[Top]


