


Philippine Growth Has Not Been Inclusive
While growth has improved from the dismal levels of the 80s and 90s, the average GDP growth of the last decade will not be enough to address some major challenges the Philippines faces. Although the highest of the last three decades, growth has not been enough to achieve any significant reduction in the percent of the population living in poverty. Growth in the Philippines has not been inclusive. By contrast, Malaysia and Thailand, with comparable GDP growth rates in the decade but lower population growth rates, have nearly eliminated their lowest cohort of poverty. Indonesia and Vietnam have reduced their poverty incidence by roughly 50% from 1990 to 2006 (see Figures 4 and 5)


Figure 4: Poverty incidence, average, < $US1.25 benchmark, 1990-2011
Source: PovcalNet (World Bank)
Note: Figures represent the average poverty rates during the specific period. Frequency of family income and expenditure surveys vary across countries. Data for Indonesia are calculates as the weighted average of rural and urban poverty rates. Urban and rural populations (from World Bank) are used as weights.
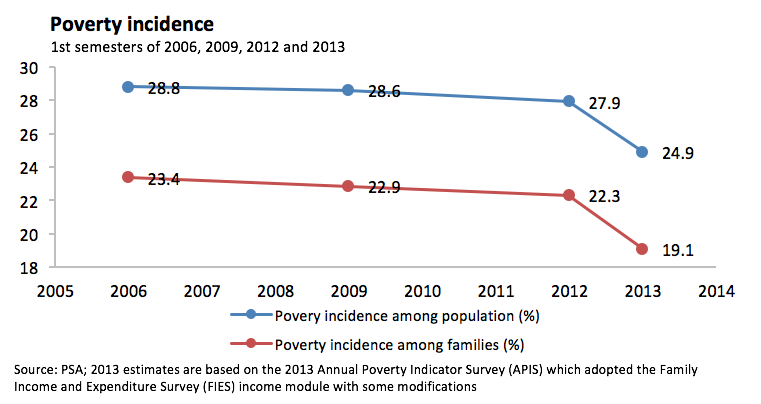
Figure 5: Poverty incidence, 1st semesters of 2006, 2009, 2012 and 2013
Source: PSA; 2013 estimates are based on the 2013 Annual Poverty Indicator Survey (APIS) which adopted the Family Income and Expenditure Survey (FIES) income module with some modifications.
“My biggest frustration as presidential adviser is that 34 quarters of uninterrupted expansion in the past 9 years did little to reduce poverty and the number of poor of people,”Albay Gov. Joey Salceda said… While the Arroyo administration continued to crank out glowing economic growth data, “these rosy figures cannot hide the fact that there are more poor people now than when the president started her term.” He cited data from the NCSB which showed that the number of poor Filipinos—5-member families living on a little more than P1,200 a month—rose to 27.6 million in 2006 from 25.5 million in 2001. In addition, the incidence of hunger nearly doubled from 11.4% in 2000 to 20.3%last year. “Given our avenge economic growth in the last four decades, it would take 37 years for these poor to get out of poverty.”
—Albay GovernorJoey Salceda, PDI,March 8, 2010
In the fast growing Asian region, the Philippine economy is slowly becoming smaller than the other ASEAN-5 in percentage share of GDP (see Figure 6) and in PCI (see Figure 7). Based on current trends, Vietnam’s PCI may pass the Philippine in 2014. Indonesia’s PCI (measured in dollars) passed the Philippines in 2009.
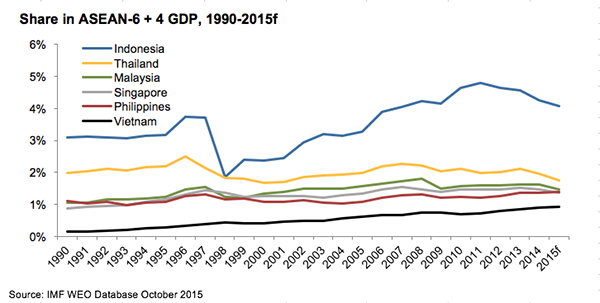
Figure 6: Share in ASEAN-6 + 4 GDP, 1990-2015f
Source: IMF WEO Database October 2015
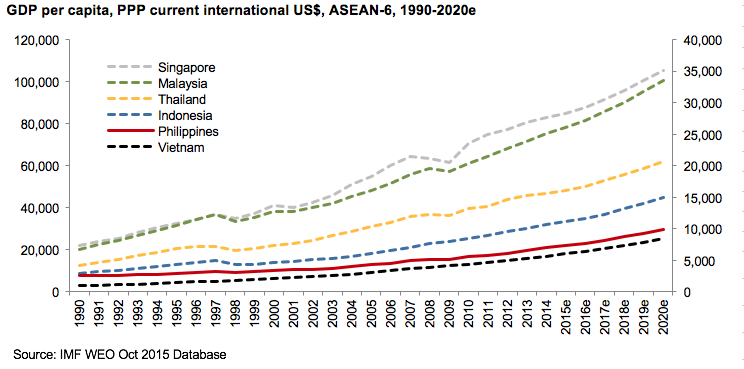
Figure 7: GDP per capita, PPP current international US$, ASEAN-6, 1990-2020e
Source: IMF WEO Oct 2015 Database
Figure 8 demonstrates how PCI growth in the Philippines lagged far behind the ASEAN-6 economies during 1981-2000 period when per capita growth was much higher in the other economies. High population growth and political instability dragged down PCI growth in the 80s and 90s. In the current decade PCI growth has increased in the Philippines to a level closer to the other five economies, except Vietnam. During this decade, inward remittance flows from an increasing number of Filipinos abroad rose to 10% of GDP and provided much of the 4.4% average annual GDP growth over the period. At the same time, the population growth rate eased from an average of 2.21% in 1991-2000 to 1.90% in 2001-2008, according to World Bank data (see Figure 9).
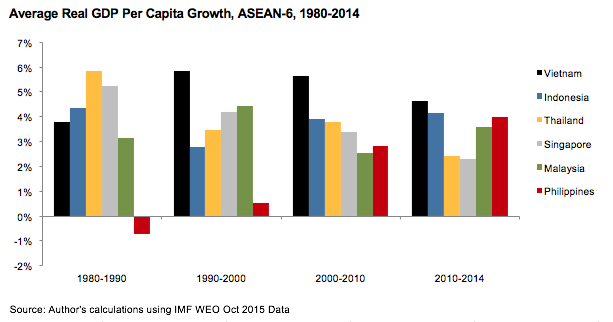
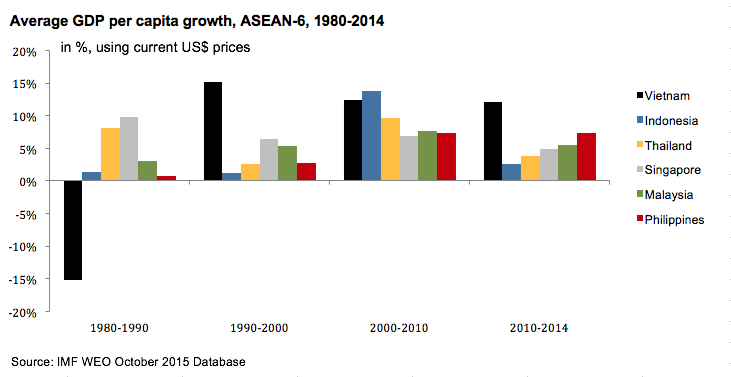
Figure 8: Average real GDP per capita growth, ASEAN-6, 1980-2014
Source: Author’s calculations using IMF WEO Oct 2015 Data
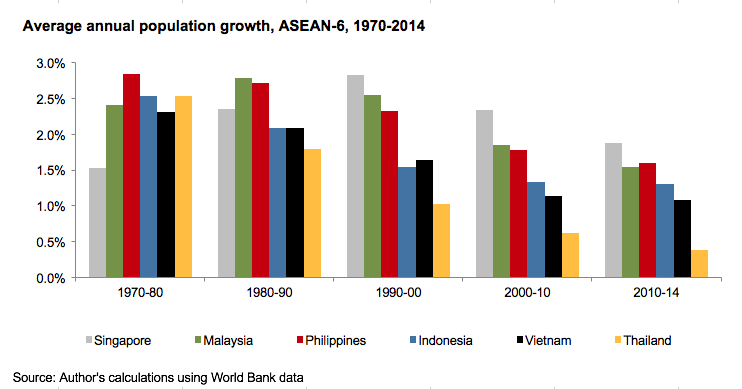
Figure 9: Average annual population growth, ASEAN-6, 1970-2014
Source: Author’s calculations using World Bank data
Figure 9 shows population growth rates of the ASEAN-6 over nearly a half century. Singapore is well-known for growing through immigration and Malaysia considers its population too small and encourages larger families. The other four countries have all experienced population growth rate declines over these five decades, with the Philippines still at a high rate near 2% per year, Vietnam and Indonesia below 1.5% and Thailand close to 1%, the only ASEAN-6 economy near the stable population replacement rate.
“The world has been passing the Philippines by, literally. Back in 1960, the country had the second-highest per capita income in Asia, lagging behind only Japan. But by the followingdecade, South Korea and Taiwan had surpassed it, and by the 1980’s, Malaysia and Thailand had, too.China overtook it in the late 1990s. And now — an event that many Philippine elite thought they would never live to see — Indonesia has sailed past the Philippines”
—Ruchir Sharma, Newsweek, January 22, 2010


