


The Philippine Economic Landscape in 2010: Faster Growth is Essential
Decades Lost to Slow Growth
As it begins the second decade of the 21st Century, the Philippines faces a major challenge to move its economy to a higher level of growth and job creation than it has experienced during the past often turbulent decades.
Figure 1 presents Philippine economic growth rates from 1981 to 2009 and clearly shows the boom-and-bust cycles triggered by the brutal assassination of former Senator Aquino in 1983, the military coup attempt of December 1989, the power blackouts of 1991-1992, and the Asian financial crisis in 1997. Each crisis forced GDP growth into negative territory and significantly reduced the PCI for a fast-growing population.
However, the two shocks to the economy of the more recent decade, EDSA 2 in early 2001 – a setback caused by internal political instability – and the 2008 global crisis – caused by external financial instability – were cushioned by rising inflows of remittances from the fast growing diaspora of Filipinos seeking income opportunities abroad. Remittances were 8.5% of GDP in 2001 and reached 10.8% of GDP in 2009. While GDP growth did not become negative, PCI growth slowed after EDSA 2 in 2001 and also in 2008-2009 following the global financial crisis.
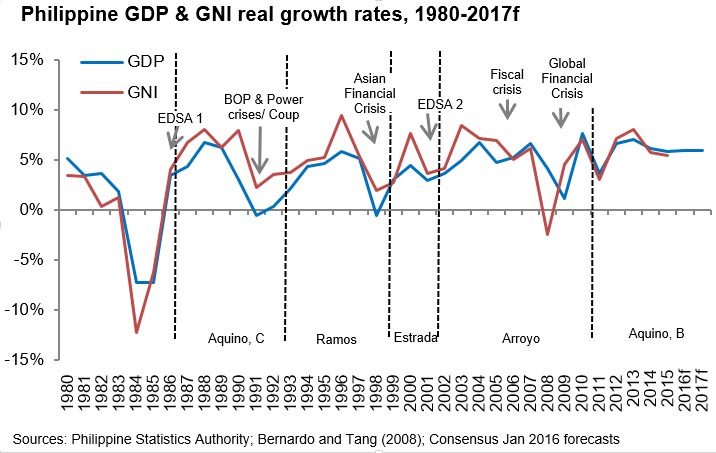
Figure 1: Philippine GDP and GDI real growth rates, 1981-2009
Sources: NSCB; Bernardo and Tang (2008)
President Gloria Macapagal Arroyo often pointed out that GDP grew every one of the 38 quarters since she became president in January 2001. In the 2nd quarter of 2007 the rate reached 8.3%,5 its highest since 12.4% in the 4th quarter of 1988, a year before the December 1989 coup attempt scared off foreign investors and traders. For the 38 quarters through mid-2010, GDP growth averaged 4.6%.
She also often refers to her vision for the Philippines to attain first world economic status in a generation. No one can disagree with this vision. The country certainly has the potential to grow at much higher rates and is in a region with an increasing number of first world economies. But the vision requires concrete detail within the framework of a master reform plan.
“Much work remains to be done, but I am determined to turn over to the new government a new Philippines ready for challenge of giving the nation First World status in 20 years.”
—President Gloria Macapagal Arroyo (February 5, 2010. Lipa City, Batangas)
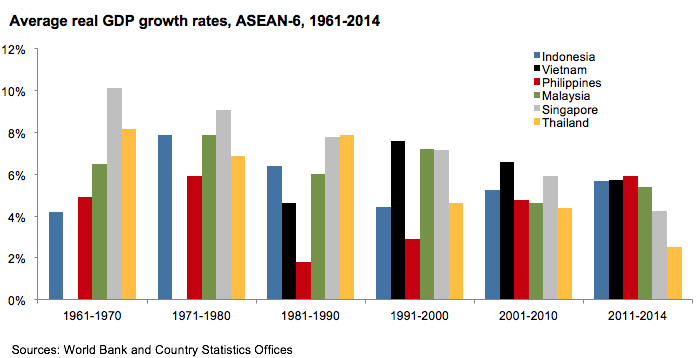
Figure 2: Average real GDP growth rates, ASEAN-6, 1961-2009
Sources: World Bank, IMF, and ASEAN Secretariat statistics offices; Note: No data for Vietnam before 1985
Among the ASEAN-6 economies over the last five decades the Philippines has been the poorest performing economy for both GDP growth and PCI growth. Figure 2 clearly shows Singapore’s fast growth averaging around 8% for four decades, until reaching its current mature economy status during the present decade when average growth has slowed to some 4%.6 The figure also shows that Malaysia and Thailand were the next two fastest growing ASEAN-6 economies until Vietnam commenced the high growth track it has maintained for the last two decades.
While the Philippines with average growth of 5-6% was respectably placed among these fast growers in the 60s and 70s, the political instability of the 80s pushed its average annual growth below 2%, lower than its population growth rate of 2.64% (1980-1990). In the 90s economic growth of 3% slightly exceeded population growth of 2.34% (1991-2000) (see Figure 9 average annual population growth, 1961-2008).
Only in the current decade does Philippine economic growth at 4.4% again – after two decades – approximate that of the other ASEAN-6 (except Vietnam) as remittances grow and the population growth rate declines to 1.90% (2001-2009). Figure 8 shows two decades of almost flat PCI growth in the Philippines, while the other ASEAN-6 economies steadily increased the average PCI of their citizens.
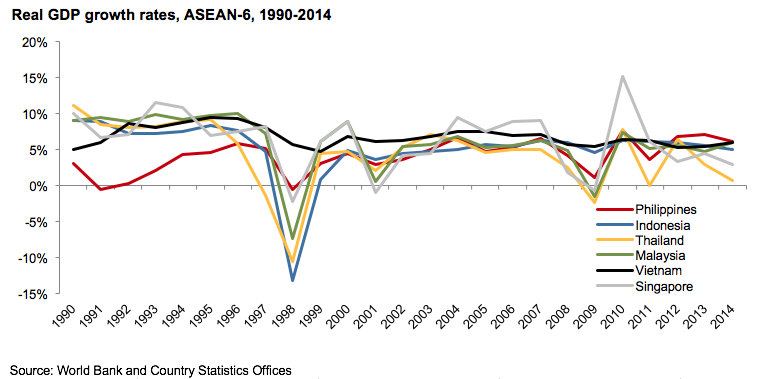
Figure 3.1: Real GDP Growth Rates among the ASEAN-6, 1990-2009
Source: IMF
Figure 3.2: Real GDP Growth rates among the ASEAN-6, 1990-2020-f
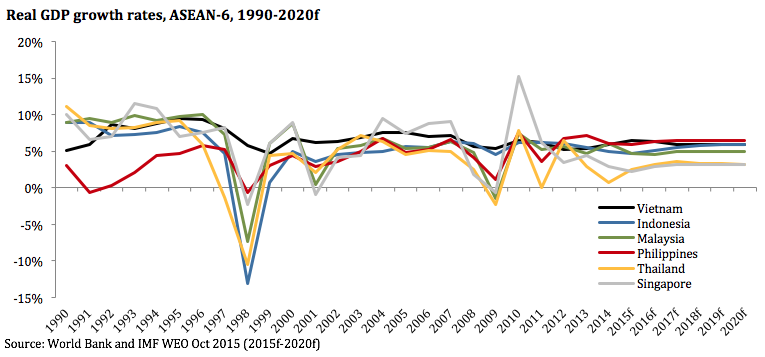
Figure 3.2: Real GDP Growth rates among the ASEAN-6, 1990-2006
Source: IMF
Footnotes
- There is a break in the National Income Accounts series. Data from Q1-2004 going forward are not comparable to data from Q4-2003 back due to methodological revisions. Some Philippine economists also deem that growth rates are “overestimated” by 1-2 percentage points after the Asian Financial Crisis (particularly after 2000). [Top]
- Highly dependent on exports, the Singapore economy rebounded in Q1 2010 with an all-time record increase of 32%. [Top]


