


Low Foreign Direct Investment Flows
The figures and tables in this section contain data of the last two decades and show FDI flows into ASEAN-6 economies in relation to the ASEAN-6 with the Philippines ranking low in many tabof these measures of FDI.
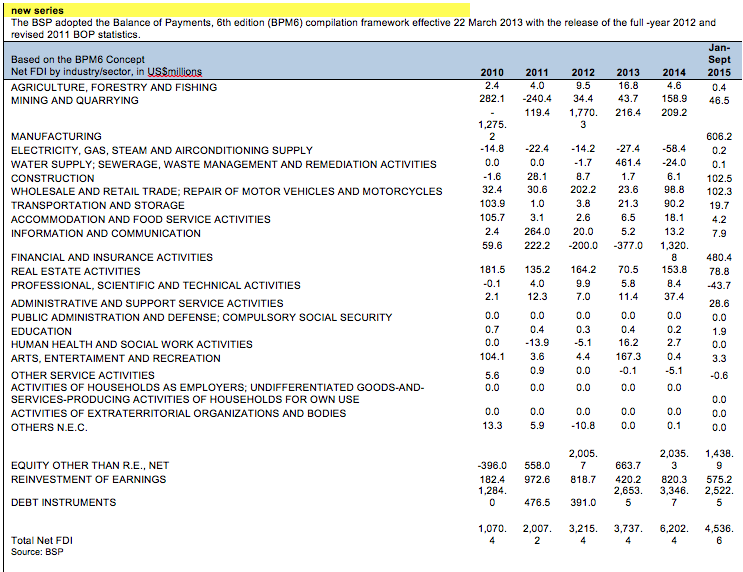
Political instability deters foreign investment. Figure 22 shows the annual net FDI of the Philippines from 1990-2009. Over this period annual FDI averaged US$ 1.4 billion. During the two-decade period 1970-1989, which encompassed continuing political turmoil, net FDI of the figuPhilippines averaged US$ 200 million (see Table 12). During the nearly two-decade period 1990-2009, net FDI of the Philippines has averaged a much higher US$ 1.4 billion. Net FDI reached nearly US$ 3 billion in 2006 and 2007, declined sharply to US$ 1.54 billion in 2008. 2009 saw an increase to US$ 1.95 billion.
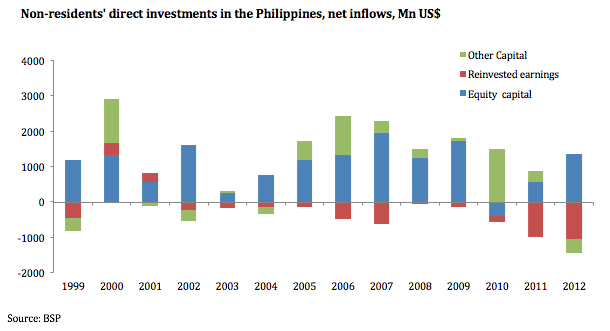
Figure 22: Non-residents direct investment in the Philippines, net inflows in US$ millions from 1999 to 2012
Source: BSP
Figure 23 compares annual net FDI of the ASEAN-6 from 1990-2009. In most years, the Philippines received less net FDI than the other five ASEAN-6 economies. Table 6 provides the annual FDI flow amounts on which Figure 23 is based.
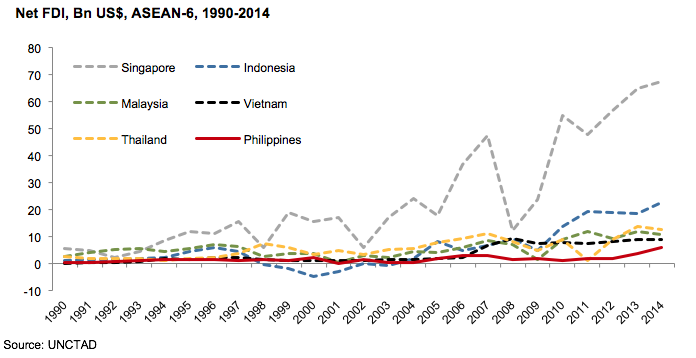
Figure 23: Net FDI in US$ billions among the ASEAN-6 from 1990 to 2014
Sources: UNCTAD
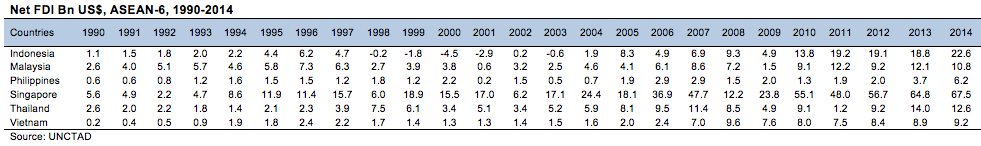
Figure 24 compares annual net FDI of the ASEAN-6 from 1990-2009 as a percentage of GDP. The Philippines (followed by Indonesia) has the lowest percentage – less than 2% in recent years – by this measure. By contrast for Singapore and Vietnam annual net FDI inflow exceeds 10% of GDP. Table 7 provides the annual percentages on which Figure 24 is based.
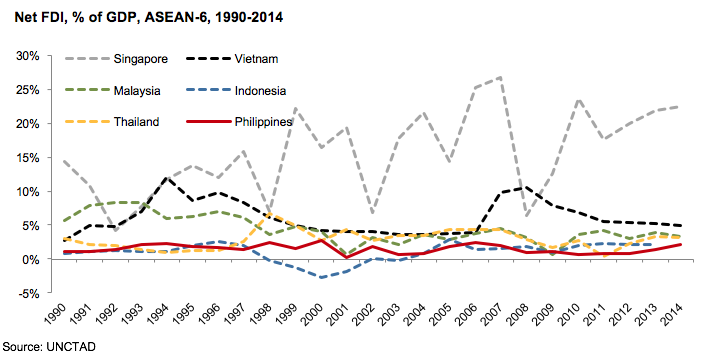
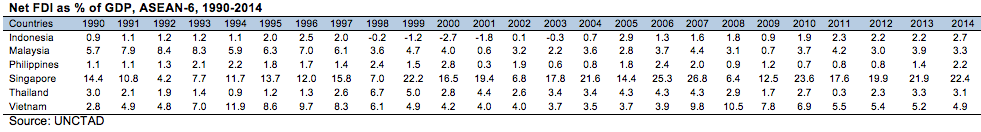
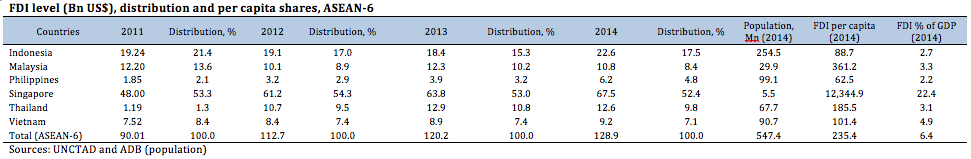
Table 8 contains data for per capita FDI of the ASEAN-6 for 2009. The Philippines with US$ 21 per capita ranks with Indonesia with US$ 22. However, it should be noted Indonesia is receiving a strong inflow of FDI capital in 2010.
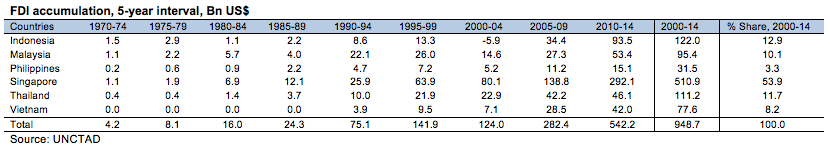
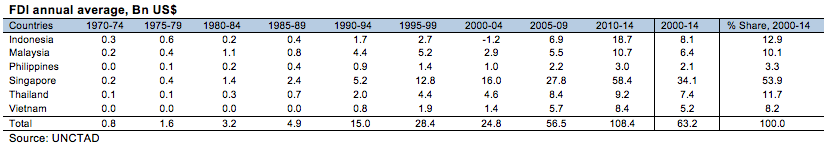
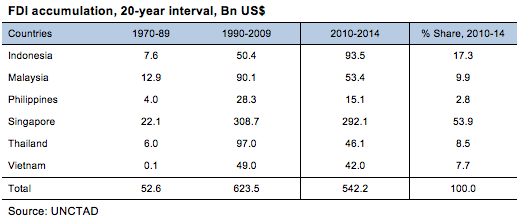
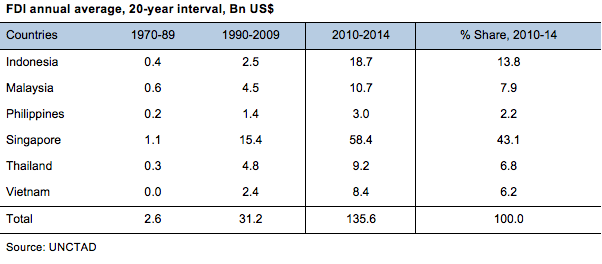
Tables 9, 10, 11, and 12 show FDI accumulation and annual averages in intervals of 5 and 20 years for four decades 1970 to 2009. With the exception of Vietnam, which was at war and a closed economy until the 90s, the Philippines has consistently received less FDI than the other ASEAN-6. For the entire period the ASEAN-6 each received (in descending order of magnitude) Singapore US$ 286 billion, Malaysia US$ 103 billion, Thailand US$ 104 billion, Indonesia US$ 58 billion, Vietnam US$ 44 billion and the Philippines US$ 32 billion. During the period 2000-2009, the Philippines received 5.1% of total FDI flowing into the ASEAN-6, while Singapore received 45.6%, Thailand received 16.6%, Malaysia received 16.4%, Indonesia received 9.3%, and Vietnam received 7.0%.
Many analysts predict FDI in SEA will take several years to regain its robust levels prior to the financial crisis. However, the interest of large manufacturing firms in a China+118 strategy for ASEAN operations, the coming into force of ASEAN FTAs making ASEAN economies more attractive for international investment, the interest of the EU to enter into bilateral FTAs with some of the ASEAN countries, the appreciation of the yen and the growing interest of investors from China in the region are positive indicators for improved trans-border capital flows. Multinationals that reduced or postponed new investment decisions may decide to go ahead in 2010 and 2011.
With some important exceptions (i.e. business process outsourcing, consumer goods, mining, semiconductors, shipbuilding, tourism) many multinational firms not already present in the Philippines do not see the country as attractive for new investment, preferring to focus on opportunities elsewhere in Asia.
However, there are thousands of multinational firms that are investors in the Philippines – some for more than a century – who are quite familiar with the Philippine investment climate. Table 13 shows the top sectors where foreign capital has been invested. Most of these companies have steadily expanded their operations in the country, either for export or for the growing domestic market. Only a few have left, usually to consolidate manufacturing within ASEAN in another ASEAN-6 economy, as ASEAN Free Trade Area (AFTA) established its zero tariff regime for the ASEAN-6.
18 China+1 strategy is followed by large multinationals that seek to have operations in the Asian region in China and at least one additional economy.
Information Technology-Business Process Outsourcing (IT-BPO) is the fastest growing sector involving FDI in employment terms. An estimated US$ 700 million in new investment is expected in 2010 and 2011. The electronics sector, which has averaged almost US$ 700 million a year in new investment since 2000, counted US$ 400 million in 2008 and US$ 480 million in 2009, and should move back towards its average with the high growth in Asia in 2010 and the strong growth of the recovering US economy.19
Mining investment, despite its great potential and having attracted serious interest of global majors in several multi-billion dollar projects, is moving slowly due to local community opposition and depressed commodity prices. However, demand for minerals such as copper, gold and nickel (which the country has large deposits of) remains strong. The largest project to date, a leading global mining firm with a minority partner from China has confirmed plans to go forward with a potential US$ 5.2 billion 10-year investment in copper and gold in Mindanao.20 New FDI in job-generating shipbuilding should resume when global demand for new ships recovers in several years.
As noted many multinationals already operating in the Philippine domestic market invest steadily to meet rising domestic consumer demand, but new FDI manufacturing is often deterred by high labor, logistics, and power costs, and bypasses the Philippines. Some new FDI in infrastructure21 (power, telecommunications, transportation, water) continues but at levels far below the many billions that could be attracted with a better investment climate. Some new FDI is entering from Kuwait and Saudi Arabia in hotels and logistics and from Asia in agriculture. Investment from China has remained weak due to local corruption.22
Footnotes
- Government Capital Outlay (% of GDP, 2005): Philippines (2.5), Indonesia, (8.5), Vietnam (8.2), and Malaysia (6.5) per Dr. Raul V. Fabella.
- 2009 levels of social spending as % of GDP: Education – 2.9%; Health – 0.5%; Social security and welfare – 1.2%; Housing and other amenities – 0.1% (Source: ADB Key Indicators, 2010).
- There is a break in the National Income Accounts series. Data from Q1-2004 going forward are not comparable to data from Q4-2003 back due to methodological revisions. Some Philippine economists also deem that growth rates are “overestimated” by 1-2 percentage points after the Asian Financial Crisis (particularly after 2000). [Top]
- Highly dependent on exports, the Singapore economy rebounded in Q1 2010 with an all-time record increase of 32%. [Top]
- Highly dependent on exports, the Singapore economy rebounded in Q1 2010 with an all-time record increase of 32%. [Top]


