


Living in the High Growth Neighborhood
The Philippines is located in the world’s fastest growing region. Figure 10 shows that the ASEAN-6 plus 4 (China, India, Japan, and Korea) in 2009 had about the same share 23.4% of world GDP as the United States (24.5%) and the EU (21.4%).
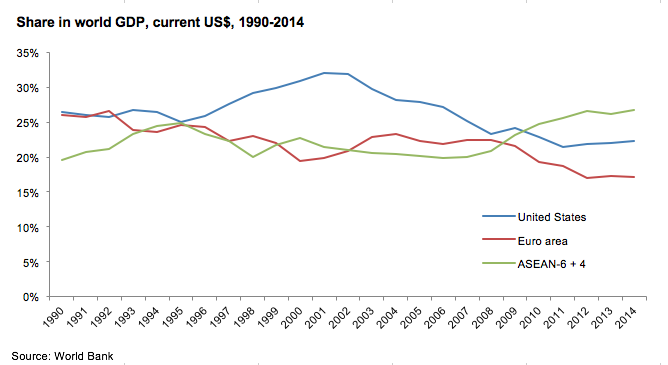
Figure 10: Share in world GDP, current US$, from 1990-2014
Source: World Bank
In its April 2010 report Emerging Stronger from the Crisis, the World Bank emphasized the significance of China in keeping the region stable amid rough global economic conditions.7The report noted that “largely thanks to China, the region’s output, exports and employment have mostly returned to the levels before the crisis.” Accordingly, latest projections of the Bank show that, real GDP growth in developing East Asia is poised to rise to 8.9 percent in 2010 after slowing from 8.4 percent in 2008 to 7.3 percent in 2009 (see Table 1).
Similarly, in October the IMF projected real GDP growth for Developing Asia to be 9.4% and 8.4% in 2010 and 2011, respectively.8Better than expected trade recovery and wavering real sector risks have likewise prompted the multilaterals to revise short-term growth projections in the region upwards.
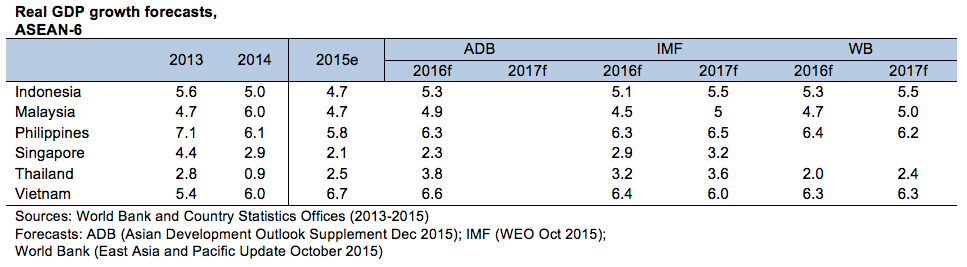
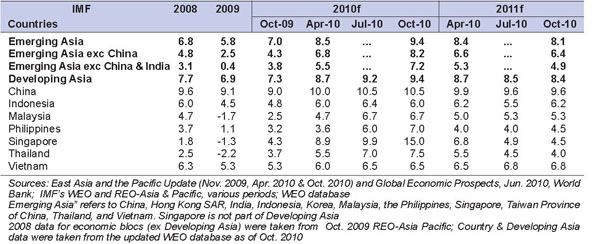
Figure 11: Real GDP growth rate forecast in annual percentage among the ASEAN-6 from 2010 to 2011
Source: IMF and World Bank as of October 2010
The World Bank uses US$ 12,000 per capita as the current threshold a country must cross to reach high income status in its country income classification. Per the World Bank, the Philippines has been classified as a “lower middle income” economy at least since 1975.9 The average high income country in 2009, with a PCI of US$ 36,000, more than twenty times the level of the Philippines in 2009, is indeed an Impossible Dream. With an annual population growth rate of around 2%, growth of 5% means the PCI of the Philippines increases only 3% a year.

Figure 12: Real quarterly GDP year-on-year growth rates among the ASEAN-6 from 2013 to 2015
Sources: Respective national statistics offices
Note: 4Q 2012 data — Country soures (Philippines, Singapore, Vietnam); Media releases (Indonesia, Thailand); author’s estimate (Malaysia)
Figure 12 shows GDP growth of the three ASEAN economies (Malaysia, Singapore, and Thailand) with the highest exports as percentage of GDP declined the most with the impact of the global financial crisis and then recovered rapidly beginning in the second half of 2009. GDP growth of the three economies (Indonesia, Philippines, and Vietnam) not as integrated into global trade declined less but also are recovering more slowly.
A much higher rate of growth than 5% will be needed to reach the World Bank’s current high income threshold of US$ 12,000 by 2030. Table 2 shows a growth rate of 11.6% is needed for the Philippines to reach a PCI of US$ 12,000 in two decades assuming a 2% population growth rate (declining to 1.5%). A declining population growth rate will reduce the number of years to reach the US$ 12,000 level.

World Bank Philippines Country Director Bert Hofman spoke about these different growth formulas in a speech10 in early 2010:
“At current growth rates, the Philippines would be as rich as today’s China in 25 years. In roughly half a century from today, it would reach income levels of Malaysia today to become an upper middle income country, and seventy years from now it will reach the US$ 12,000 per capita high income threshold that the World Bank uses…. The blessings of compounded growth imply, however, that higher growth more than proportionally eats into the time it takes to reach high income level. With 5 percent per capita growth, it takes a little over 4 decades to reach high income status and with 7 percent per capita income growth the same can be achieved in little over 3 decades. Moreover, international experience shows that as growth accelerates, fertility and population growth declines, so per capita growth can accelerate more rapidly than GDP growth.”
In 2008 the World Bank released “The Growth Report: Strategies for Sustained Growth and Inclusive Development” prepared by the Commission on Growth and Development, chaired by Nobel Laureate Dr. Michael Spence. The commission studied 13 economies that have grown in the post WWII period for 25 years or longer at an average annual rate of 7% in order to learn what they did to achieve such high rates of growth. This high growth club of countries included Botswana, Brazil, China, Hong Kong, Indonesia, Japan, Korea, Malaysia, Malta, Oman, Singapore, Taiwan and Thailand, and members of the Commission were senior economic policy makers from these countries (see Table 3). In addition to this small group of 13 economies, the Commission judged that India and Vietnam were “on their way” to increasing the group.

Thus the Philippines does not have to look any further than Asia to find examples of sustained high growth. The Asian region is famous and admired for its economic tigers. Four of its ASEAN partners – Indonesia, Malaysia, Singapore, and Thailand – are in the group, while Vietnam is on a fast track to join them. Other Asian economies – China, Japan, Korea, and Taiwan – are also among the 13 economic success stories.
What policies did these countries have in common to achieve such economic success? The Growth Report listed several that these rapid growers did right. They:
- fully exploited the world economy;
- maintained macroeconomic stability;
- mustered high rates of saving and investment;
- let markets allocate resources; and
- had committed, credible, and capable governments.
During the recent decades of political and economic turmoil, it is clear that these five key elements have not been consistently present in the Philippines. On the positive side, the Philippines since 1986 has maintained macroeconomic stability under a succession of excellent finance secretaries and Bangko Sentral ng Pilipinas (BSP) governors. In the last decade remittances have improved currency stability, external debt has fallen as a percent of GDP, and international reserves have substantially increased to almost US$ 50 billion, enough for nine months of imports, up from four months previously. However, the country has only partially exploited the international economy (e.g. with its Overseas Filipino Workers) as exemplified by its low volume of exports – which are not well-diversified – and low levels of investment, especially foreign. While there are many committed and capable individuals in government, the Philippines has yet to create sustained good governance, and growth has not been inclusive.
Another perspective on Philippine potential for economic growth comes from the American investment bank firm Goldman Sachs, which famously invented in a 2003 paper the term BRIC for the large emerging markets of Brazil, Russia, India, and China. In late 2005 Goldman Sachs identified the Next Eleven (N-11) countries with high potential of becoming the world’s largest economies in the 21st century along with the BRICs. The N-11 are Bangladesh, Egypt, Indonesia, Iran, Mexico, Nigeria, Pakistan, the Philippines, South Korea, Turkey, and Vietnam.
“Our great economic challenge is to grow by at least eight percent per annum; to raise per capita incomeof US$ 1,900 to US$ 3,200 when (my) term ends in 2016 and double by 2018. That’s a tall order, but it must be our goal… to sustain growth in the face of competition.”
—Presidential candidate Gilbert Teodoro, Makati Business Club speech, February 18, 2010
Footnotes
- “China’s massive stimulus package was a major factor in the country’s and region’s economic resilience. The program was centered in government infrastructure spending, combined with increases in transfers, consumer subsidies and tax cuts. The surge in government-led investment boosted overall GDP by 5.9 points in 2009, though most of the spending was financed through quasi-fiscal measures such as lending by state-owned banks,” (World Bank. Global Economic Prospects. June 2010).[Top]
- IMF. Regional Economic Outlook. Oct. 2010; IMF. World Economic Outlook. Oct. 2010.[Top]
- The USG Millenium Challenge Corporation (MCC), while using the same data as the WB, uses a different set of parameters to classify “low income” and “lower middle income” countries. According to MCC’s authorizing legislation, parameters for “low income” candidate countries are whether PCI is equal to or less than the historical ceiling of the IDA for the FY involved (for example, US$ 1855 for FY10). “Lower middle income” candidate countries must be both classified as a lower middle income country by the World Bank and have an income greater than the historical ceiling for IDA eligibility for the FY involved. By contrast, the WB defines “low income” countries (in FY10) as those countries with a GNI per capita of US$ 975 or below and “lower middle income” countries as those countries with a GNI per capita between US$ 976 and US$ 3855. There is a subset of countries that MCC defines as “low income”, based on the definitions in US legislation, that the WB considers “lower middle income.” Source, email correspondence with World Bank and MCC offices.[Top]
- Speech to the 13th Annual Foreign Correspondents of the Philippines Conference entitled “Making Growth Work for the Poor” on February 15, 2010, with most of the presidential candidates present.[Top]


